Direct material mix variance
Direct materials mix variance (also known as direct materials blend variance) occurs as a result of mixing two or more direct materials in a ratio that is different from the ratio specified by the standards to manufacture a product or produce a certain quantity of finished output. This variance is computed by only those companies that process more than one materials to produce their finished output. The companies belonging to process type industries are popular examples of such companies.
A favorable direct material mix variance indicates that a cheaper mix of direct materials than standard mix has been used in manufacturing process. An unfavorable variance, on the other hand, suggests that a more costly mix than the standard mix of direct materials has been used in manufacturing process.
Formula
The formula for computing direct materials mix variance is given below:
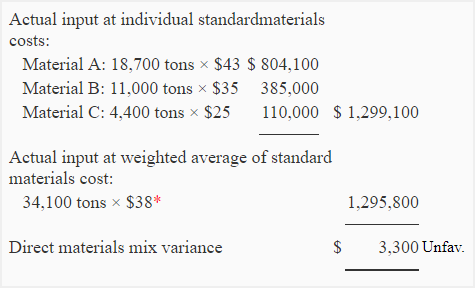
Materials mix variance = Actual input at individual standard materials costs – Actual input at weighted average of standard materials cost
Example
The Lucky Company produces cement and uses a standard costing system. The production of cement requires the mixing of three different types of materials – material A, material B and material C.
The standard quantity and standard cost of materials for producing 1,000 tons of cement are given below:

During the month of January, 32,340 tons of cement was produced. The actual quantities of three types of materials requisitioned to factory during January are given below:

Required: Compute direct materials mix variance for the month of January.
Solution

*$41,800/1,100 tons
Or we can adapt the following approach which computes direct material mix variance in total as well as for each individual material:

Explanation of the above computation
(This explanation may not be the part of your answer to examination question. It has been provided just to explain the reason of unfavorable variance)
An unfavorable direct material mix variance of $3,300 was occurred because material A, a relatively high-cost material, had been added in a proportion higher than specified by standards. The increase in cost resulting from the use of material A and material C in higher proportion could not be offset by the reduction in cost resulting form the use of material B in lower proportion. The ratios in which each individual material was allowed by standards and the ratio in which they were actually used are given below:
Standard individual materials quantity to standard total input:
- Material A: 550/1,100 = 0.5 or 50%
- Material B: 440/1,100 = 0.4 or 40%
- Material C: 110/1,100 = 0.1 or 10%
Actual individual materials quantity to actual total input:
- Material A: 18,700/34,100 = 0.55 or 55% (higher than standards)
- Material B: 11,000/34,100 = 0.32 or 32% (lower than standards)
- Material C: 4,400/34,100 = 0.13 or 13% (higher than standards)
In short, we can say that the company experienced an unfavorable direct material mix variance during the month because it used a more costly combination of materials than the combination specified by standards to produce 32,340 tons of output.

Leave a comment